
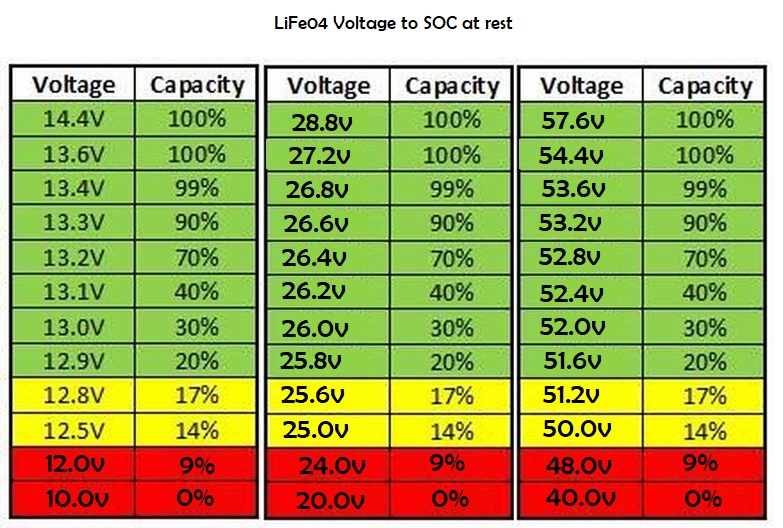
The SOC -Voltage chart give’s you a indicative state of charge based on the Battery Voltage when the battery has been at rest for 30 Min, this means no charging or loads in the past 30 Min.
These should be compared to your SOC battery monitor and the Battery monitor should read a similar figure, if it does not then usually the battery monitor needs adjustment, the SOC chart in most cases will be far more accurate.
always check these setting in your Battery monitor
1. assigned battery capacity
2. The Charged voltage (this is the voltage at which the SOC is reset to 100%
3. The batteries charge efficiency
4. the peukert exponent efficiency
5. Tail Current
Voltage Method
Measuring state-of-charge by voltage is simple, but it can be inaccurate because cell materials and temperature affect the voltage. The most blatant error of the voltage-based SoC occurs when disturbing a battery with a charge or discharge. The resulting agitation distorts the voltage and it no longer represents a correct SoC reference. To get accurate readings, the battery needs to rest in the open circuit state for at least four hours; battery manufacturers recommend 24 hours for lead acid. This makes the voltage-based SoC method impractical for a battery in active duty.
Each battery chemistry delivers its own unique discharge signature. While voltage-based SoC works reasonably well for a lead acid battery that has rested, the flat discharge curve of nickel- and lithium-based batteries renders the voltage method impracticable.
The discharge voltage curves of Li-manganese, Li-phosphate and NMC are very flat, and 80 percent of the stored energy remains in the flat voltage profile. While this characteristic is desirable as an energy source, it presents a challenge for voltage-based fuel gauging as it only indicates full charge and low charge; the important middle section cannot be estimated accurately. Figure 1 reveals the flat voltage profile of Li-phosphate (LiFePO) batteries.
Li-phosphate has a very flat discharge profile, making voltage estimations for SoC estimation difficult.
Lead acid comes with different plate compositions that must be considered when measuring SoC by voltage. Calcium, an additive that makes the battery maintenance-free, raises the voltage by 5–8 percent. In addition, heat raises the voltage while cold causes a decrease. Surface charge further fools SoC estimations by showing an elevated voltage immediately after charge; a brief discharge before measurement counteracts the error. Finally, AGM batteries produce a slightly higher voltage than the flooded equivalent.
When measuring SoC by open circuit voltage (OCV), the battery voltage must be “floating” with no load attached. This is not the case with modern vehicles. Parasitic loads for housekeeping functions puts the battery into a quasi-closed circuit voltage (CCV) condition.
In spite of inaccuracies, most SoC measurements rely in part or completely on voltage because of simplicity. Voltage-based SoC is popular in wheelchairs, scooters and golf cars. Some innovative BMS (battery management systems) use the rest periods to adjust the SoC readings as part of a “learn” function. Figure 2 illustrates the voltage band of a 12V lead acid monoblock from fully discharged to full charged.